AI-Powered Financial Analytics Platform
Built an AI-enhanced FP&A platform that generates automated variance analysis, period-over-period bridges, and executive commentary from raw financial data.
Finance team manually built Excel variance reports each month. Period bridges were created from scratch in PowerPoint. Executive commentary was written by hand after hours of number-crunching. The monthly close package took 5 business days to assemble.
The Challenge
A growing technology company had outpaced its finance infrastructure. The three-person finance team was spending the first week of every month assembling the close package: pulling trial balance data into Excel, building variance analysis spreadsheets, creating PowerPoint bridges, and writing executive commentary explaining what changed and why.
The process worked when the company had 15 line items to track. At 80+ accounts across multiple revenue streams and cost centers, it had become unsustainable. The CFO was getting the close package five business days after month-end, and by then, half the insights were stale.
The bigger issue was analytical depth. The team could tell you what changed, but explaining why required manual investigation every month. "Revenue was down 8% month-over-month" would trigger a scramble to figure out whether it was volume, pricing, mix, or timing. That investigation consumed more time than building the reports themselves.
What We Built
We built an AI-enhanced financial analytics platform that automates the entire monthly close package, from raw data to executive-ready deliverables.
The data ingestion layer accepts trial balance exports (CSV or Excel) and maps them to a standardized chart of accounts. The mapping is configured once and handles variations in naming, account numbering, and hierarchy automatically. New accounts are flagged for review rather than silently dropped.
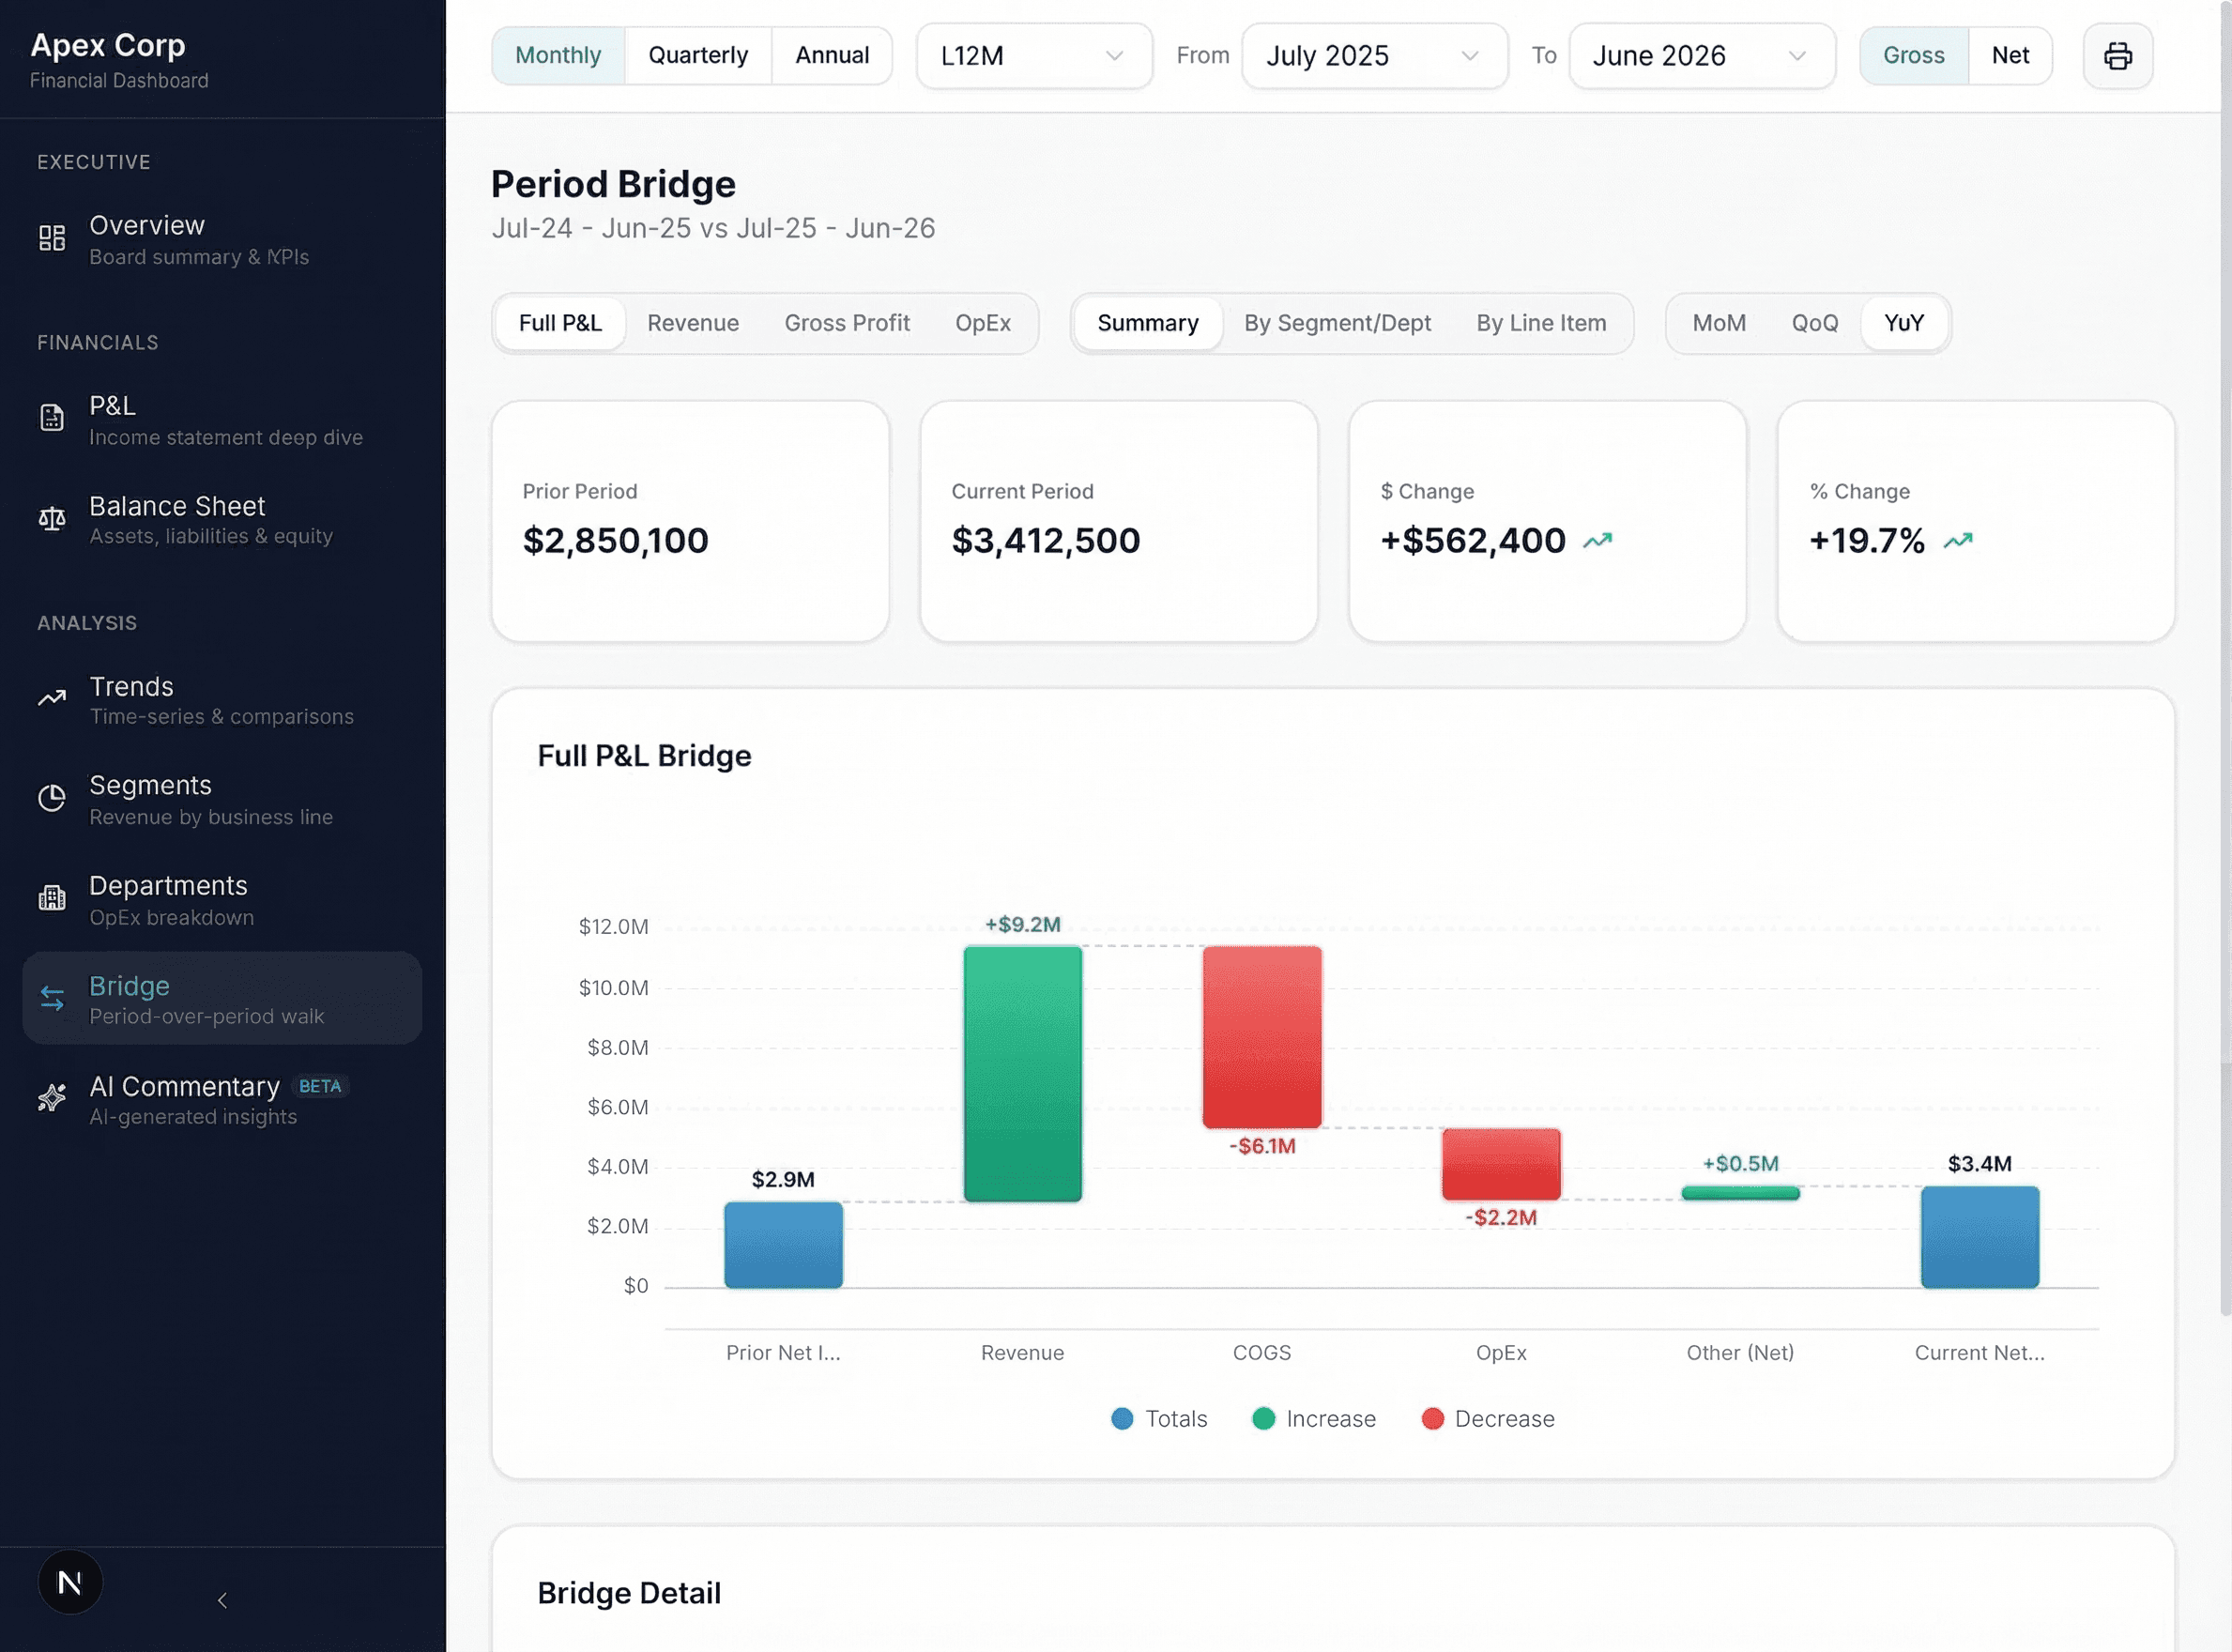
The period bridge is the centerpiece. An interactive waterfall chart shows the walk from prior period to current period across every major P&L category. Each bar is clickable, drilling down into the component accounts that drove the change. Revenue bridges show volume, price, and mix effects separately. Expense bridges isolate headcount-driven costs from discretionary spending.
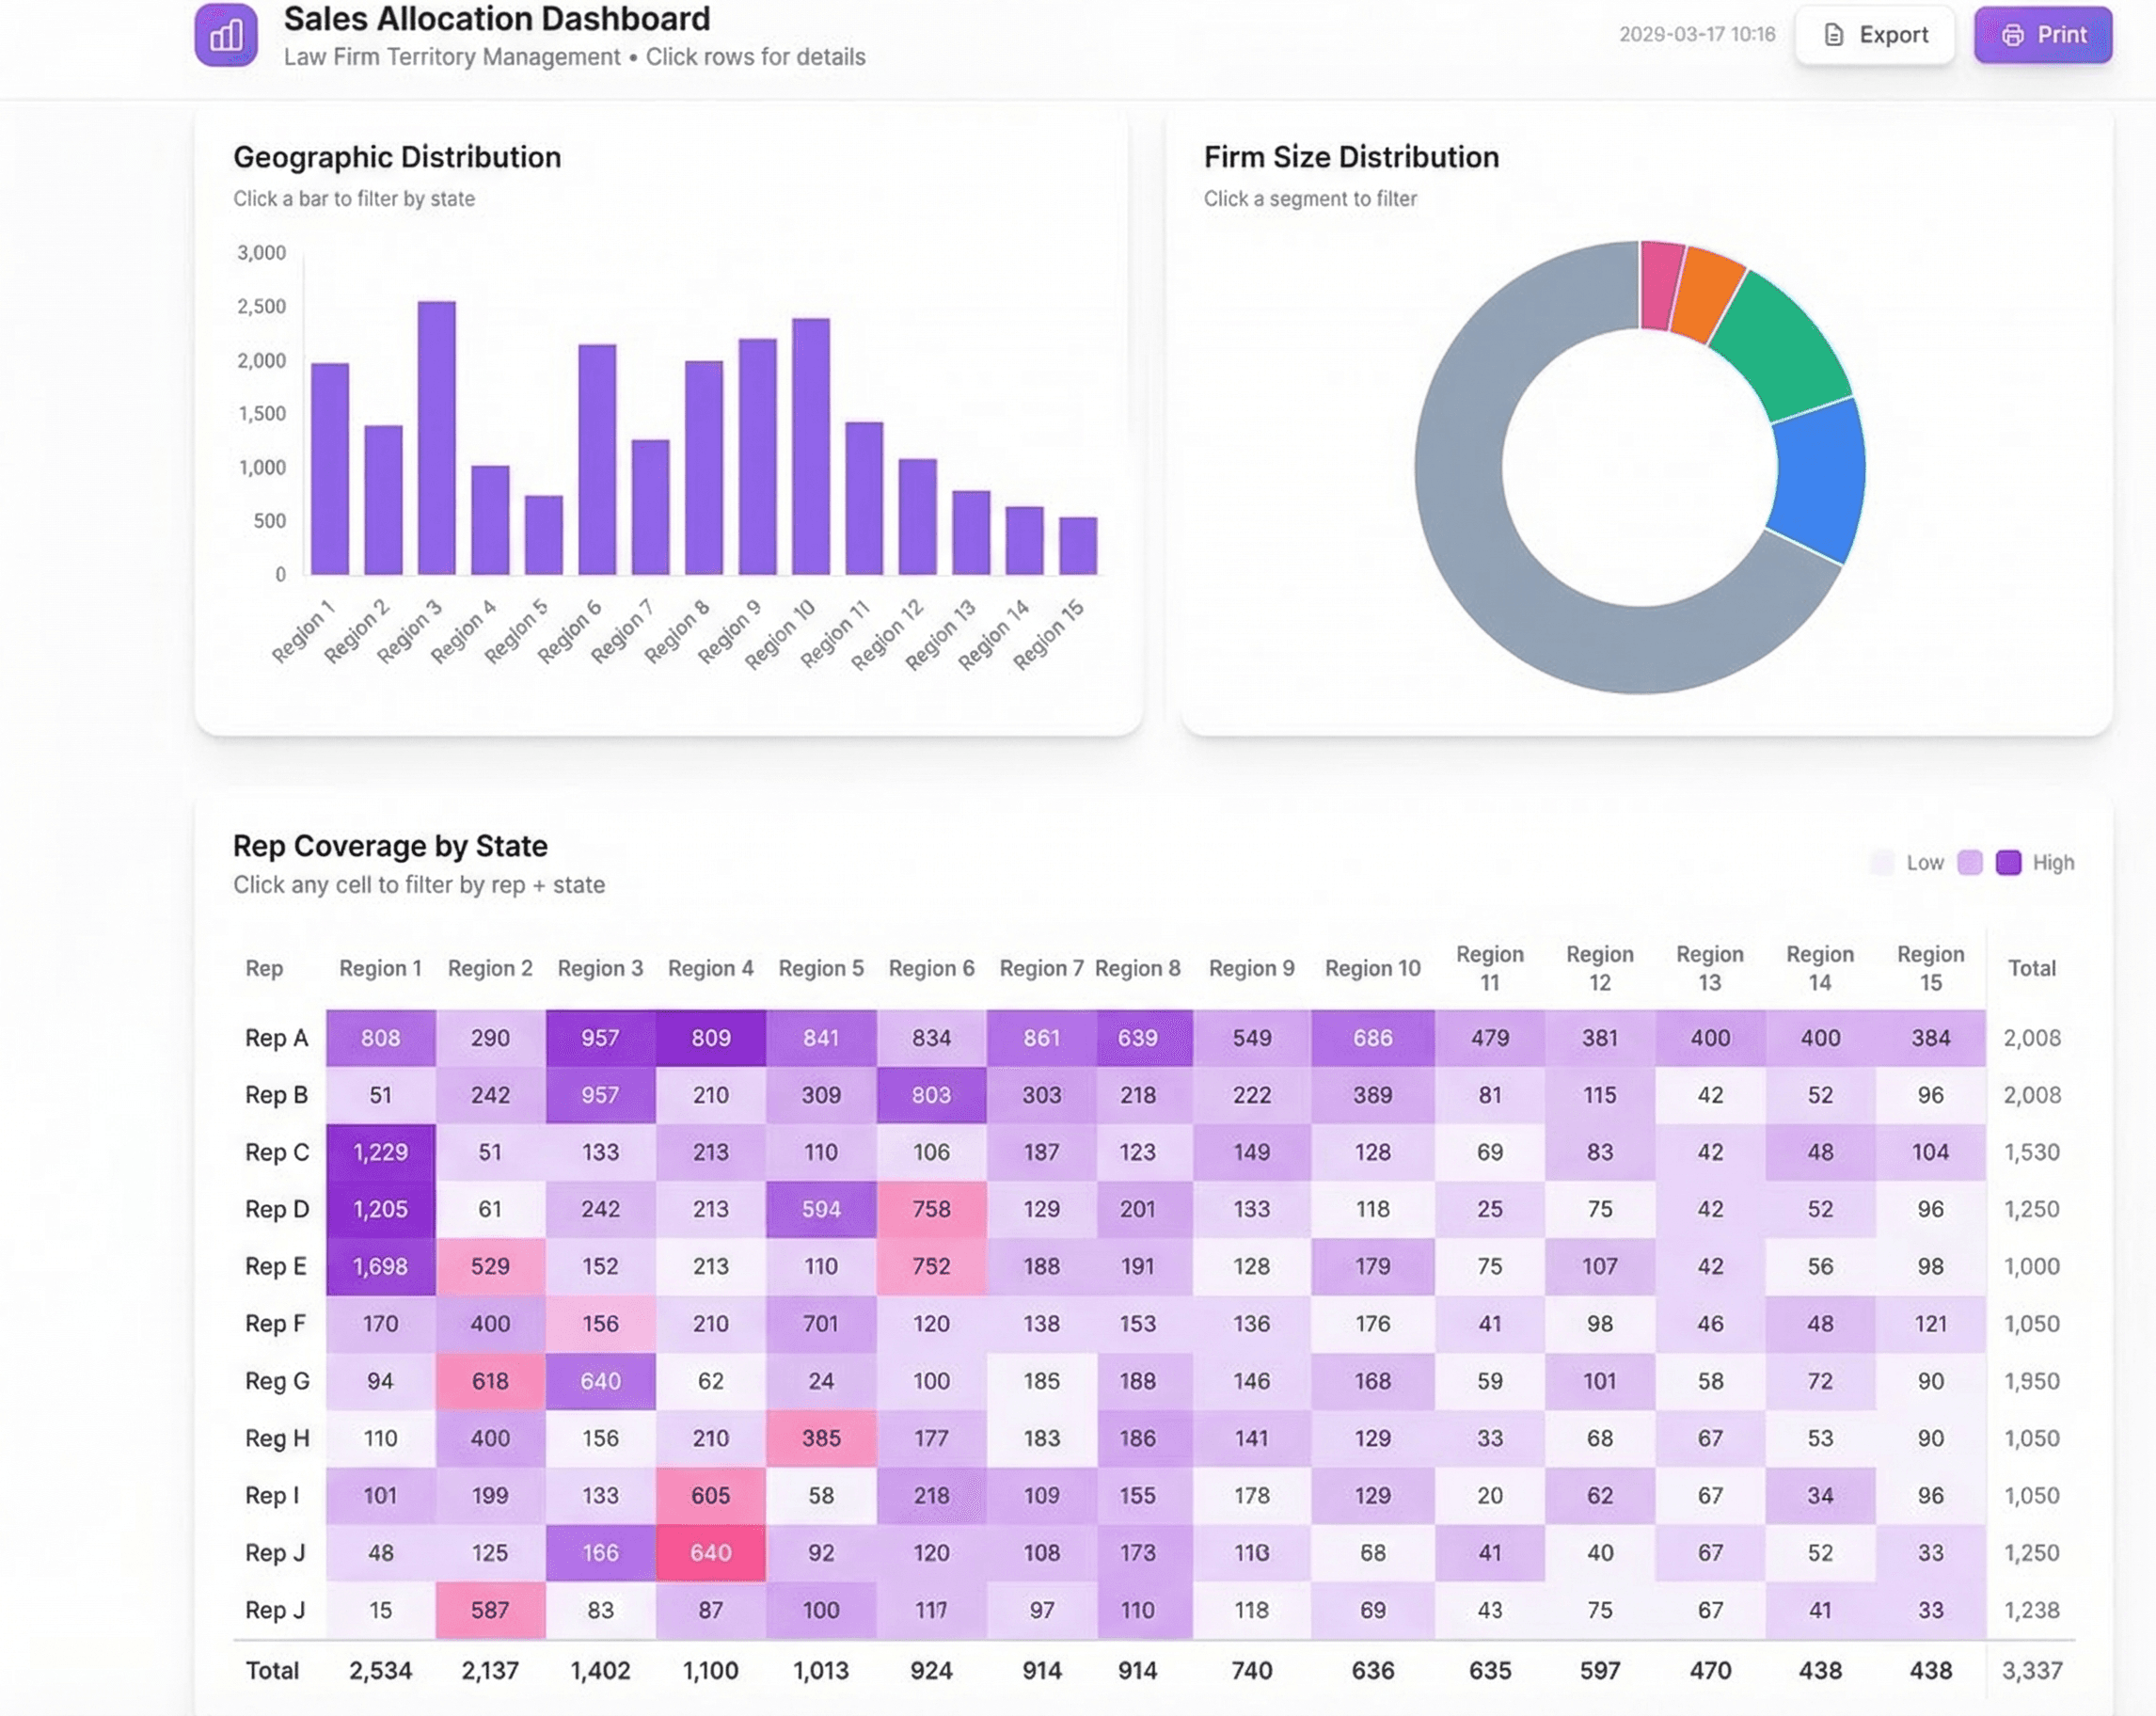
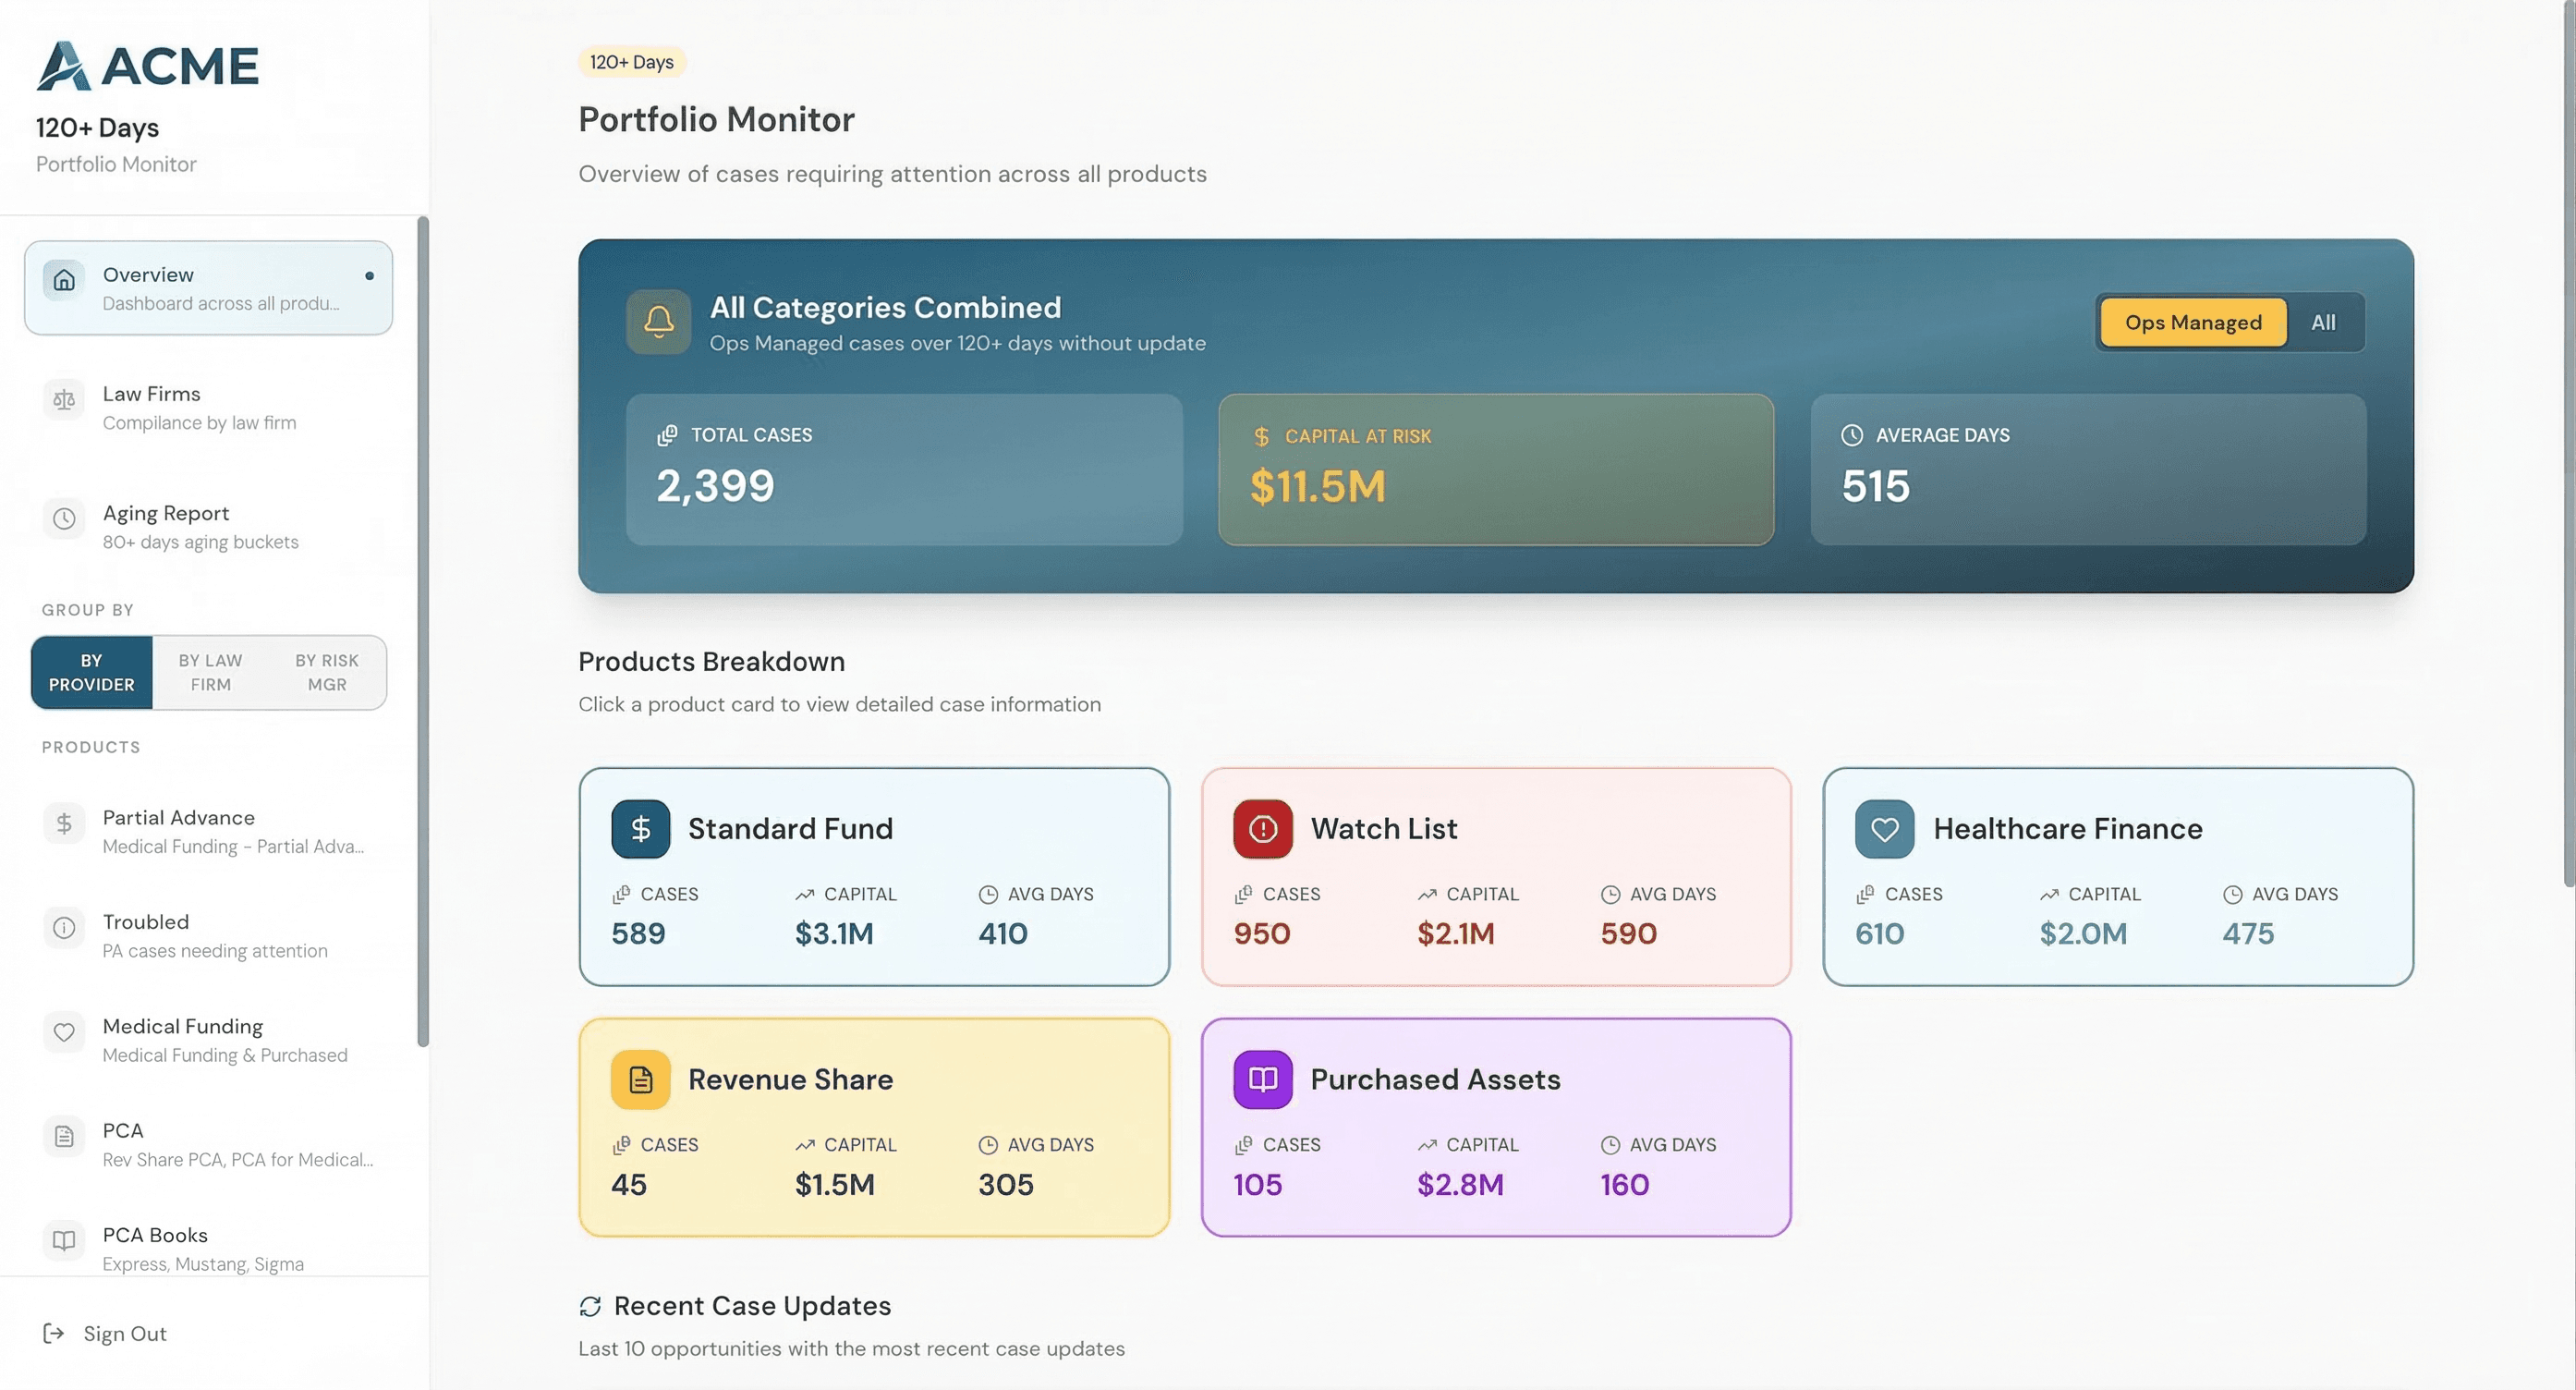
The P&L summary view presents the full income statement with built-in variance analysis. Every line item shows actual vs. budget, actual vs. prior period, and trend direction. Variances exceeding configurable thresholds are highlighted automatically, and users can drill into any line to see the underlying transaction detail.
The AI commentary engine is what transforms this from a reporting tool into an analytical platform. After the data loads, Claude analyzes every material variance, identifies patterns across line items, and generates narrative explanations. "SaaS revenue declined 8% MoM driven by three enterprise renewals that slipped into next month. Based on the signed contracts, we expect a 12% rebound. Meanwhile, professional services revenue increased 22%, offsetting the SaaS shortfall and keeping total revenue within 2% of budget."
The commentary isn't templated fill-in-the-blank. The AI examines the actual numbers, compares them to historical patterns, and produces genuine analytical insight. The finance team reviews and edits as needed, but typically ships 80% of the AI draft as-is.
Results
The monthly close package now takes one business day instead of five. The finance team uploads the trial balance on Day 1 after close, and by end of day they have a complete package with bridges, variance analysis, and draft commentary ready for CFO review.
The quality of analysis improved alongside the speed. Because the AI examines every line item every month, variances that the team might have deprioritized (small dollar amounts with large percentage swings) are now consistently flagged. In the third month of use, the AI caught a vendor billing error in a line item the team had been skipping over because the absolute dollar amount was below their review threshold.
The CFO now receives the close package on Day 2 instead of Day 5, and uses the interactive dashboard in board meetings instead of static PowerPoint slides. Board members can ask questions and get real-time drill-downs during the meeting, replacing the "we'll get back to you" dynamic that had been the norm.
Product Screenshots
Need something like this built?
I build custom dashboards and analytics tools for finance teams. Let's talk about what you're working with.
Book a 30-Minute Conversationor email us at hello@strategiq.so