Case Aging & Capital Risk Monitor
Built a real-time monitoring platform to track deployed capital across thousands of active cases, replacing monthly Excel reports with live risk detection.
Monthly Excel reports generated manually by the operations team. Capital exposure calculated quarterly. No automated alerts for aging cases or concentration risk. Issues were discovered weeks or months after they became problems.
The Challenge
The client operated a financial services business with tens of millions in deployed capital spread across thousands of active cases. Each case represented a funded position with a specific counterparty, and the portfolio's risk profile shifted daily as cases aged, settled, or deteriorated.
The existing monitoring process was entirely manual. Once a month, the operations team would export data from the core system into Excel, build pivot tables for the executive team, and flag anything that looked concerning. The report took two full days to produce and was outdated by the time it reached the C-suite.
Concentration risk was the biggest blind spot. The team knew, in general terms, which counterparties held the most capital. But they couldn't quickly answer "what's our total exposure to firms in Florida?" or "how much capital is tied up in cases older than 18 months?" These questions required custom analysis every time they came up.
When a major counterparty went silent on several cases simultaneously, the team didn't catch it for six weeks. That incident made it clear that monthly reporting wasn't adequate for a portfolio of this size and complexity.
What We Built
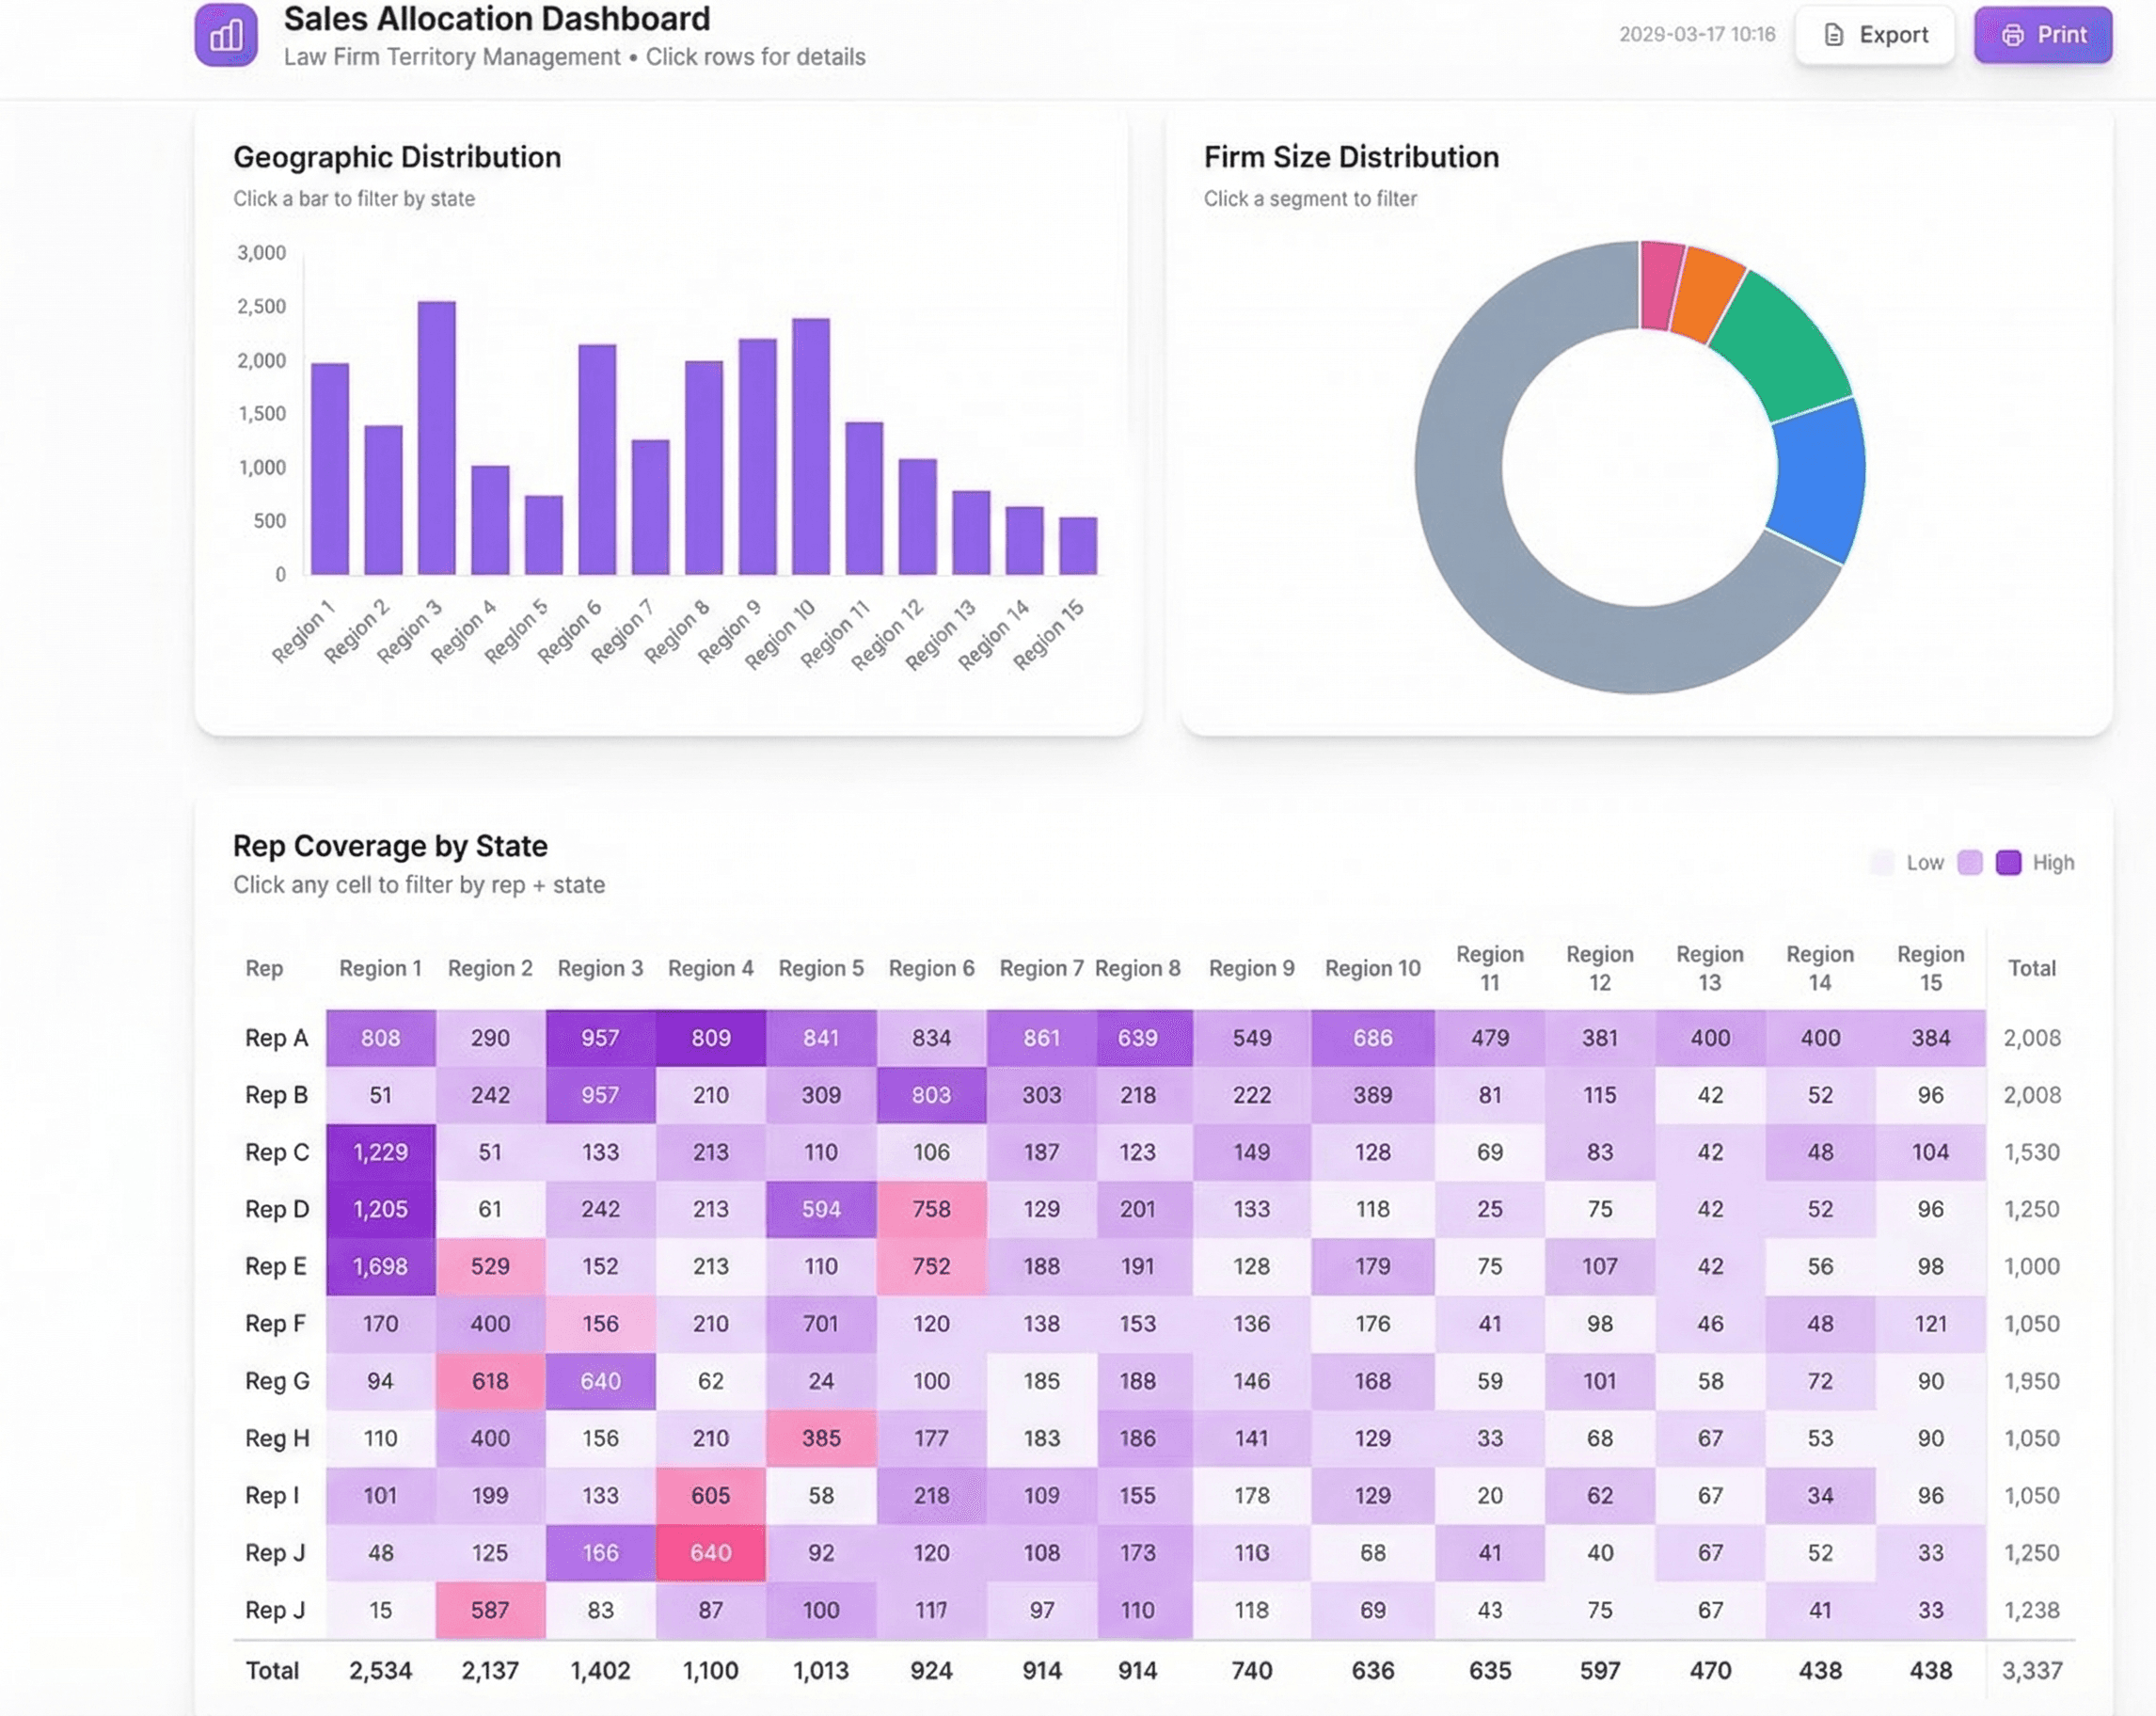
We designed a real-time portfolio monitoring platform with six distinct risk dimensions: aging, concentration, counterparty performance, product mix, geographic distribution, and settlement velocity.
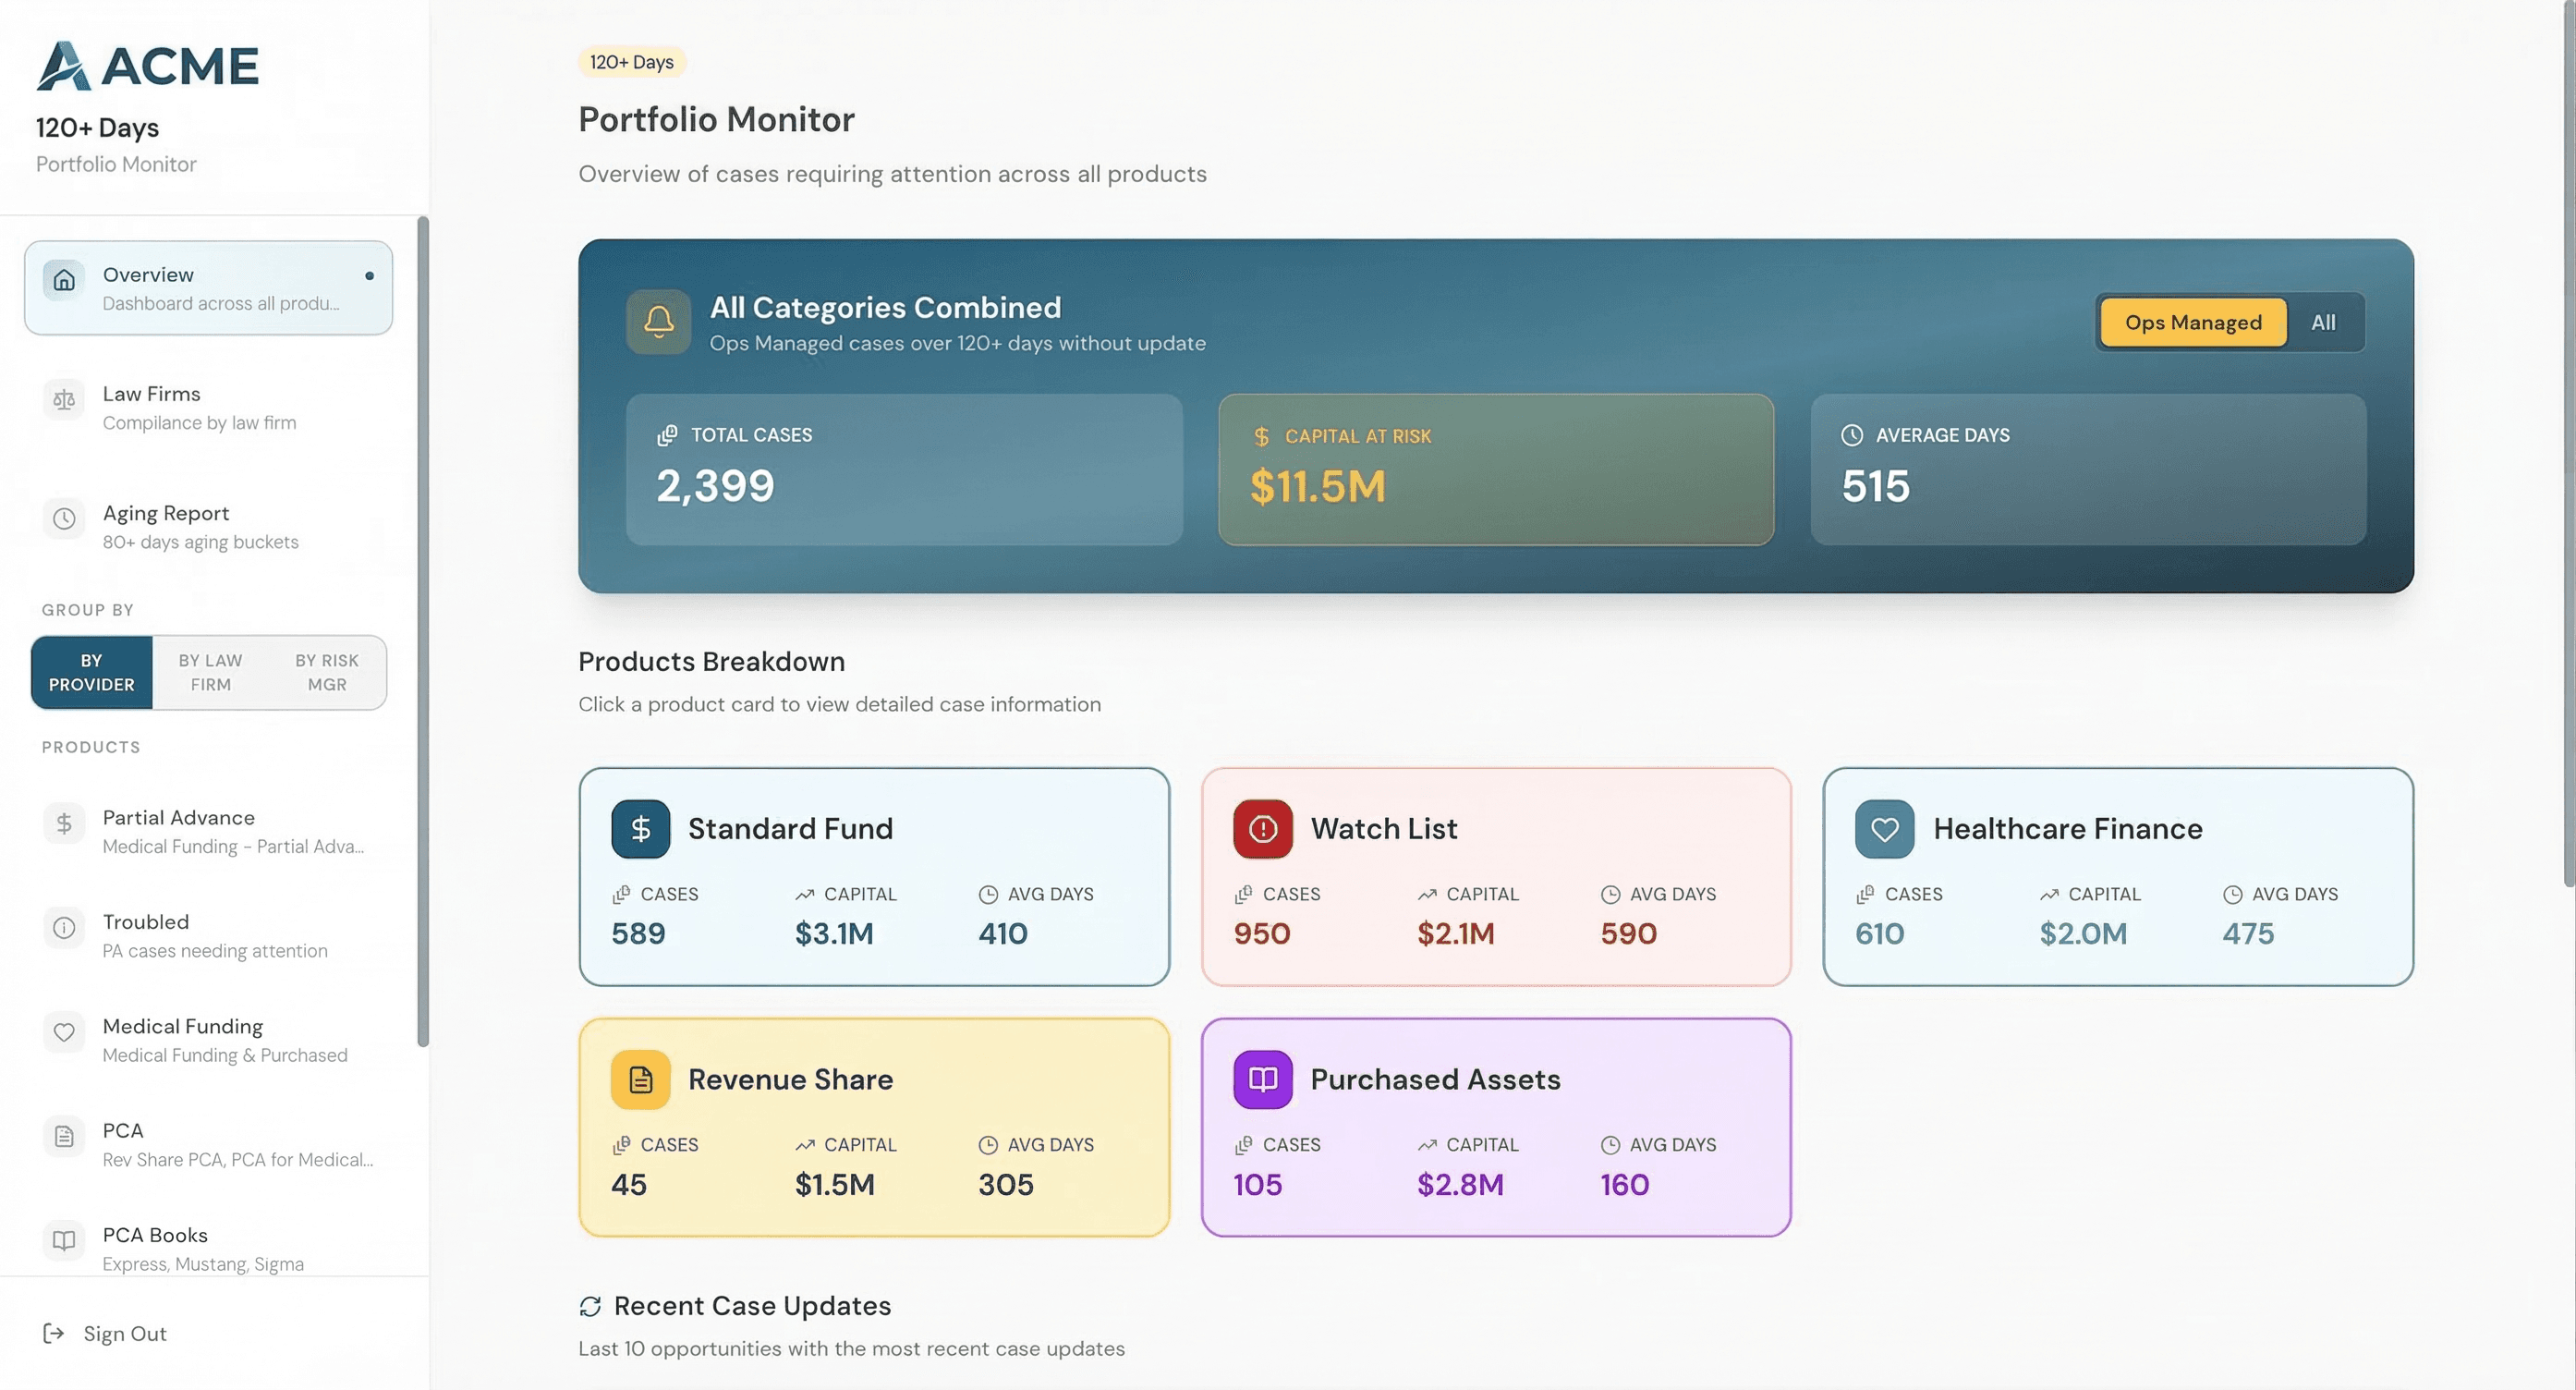
The executive dashboard opens to a set of KPI cards showing portfolio health at a glance: total deployed capital, weighted average case age, concentration score, and settlement rate. Each card is color-coded green/yellow/red based on configurable thresholds, so leadership can assess portfolio health in seconds.
The case aging module breaks down the entire portfolio by age buckets. A stacked bar chart shows capital distribution across 0-6 months, 6-12 months, 12-18 months, and 18+ month cohorts. Cases approaching the 18-month threshold get flagged automatically, giving the operations team a working queue of items that need attention.
Concentration analysis runs across multiple dimensions. The platform calculates Herfindahl-Hirschman Index (HHI) scores for counterparty concentration and displays the results as a treemap visualization. When any single counterparty exceeds the configurable threshold (default 8% of total portfolio), the system generates an alert.
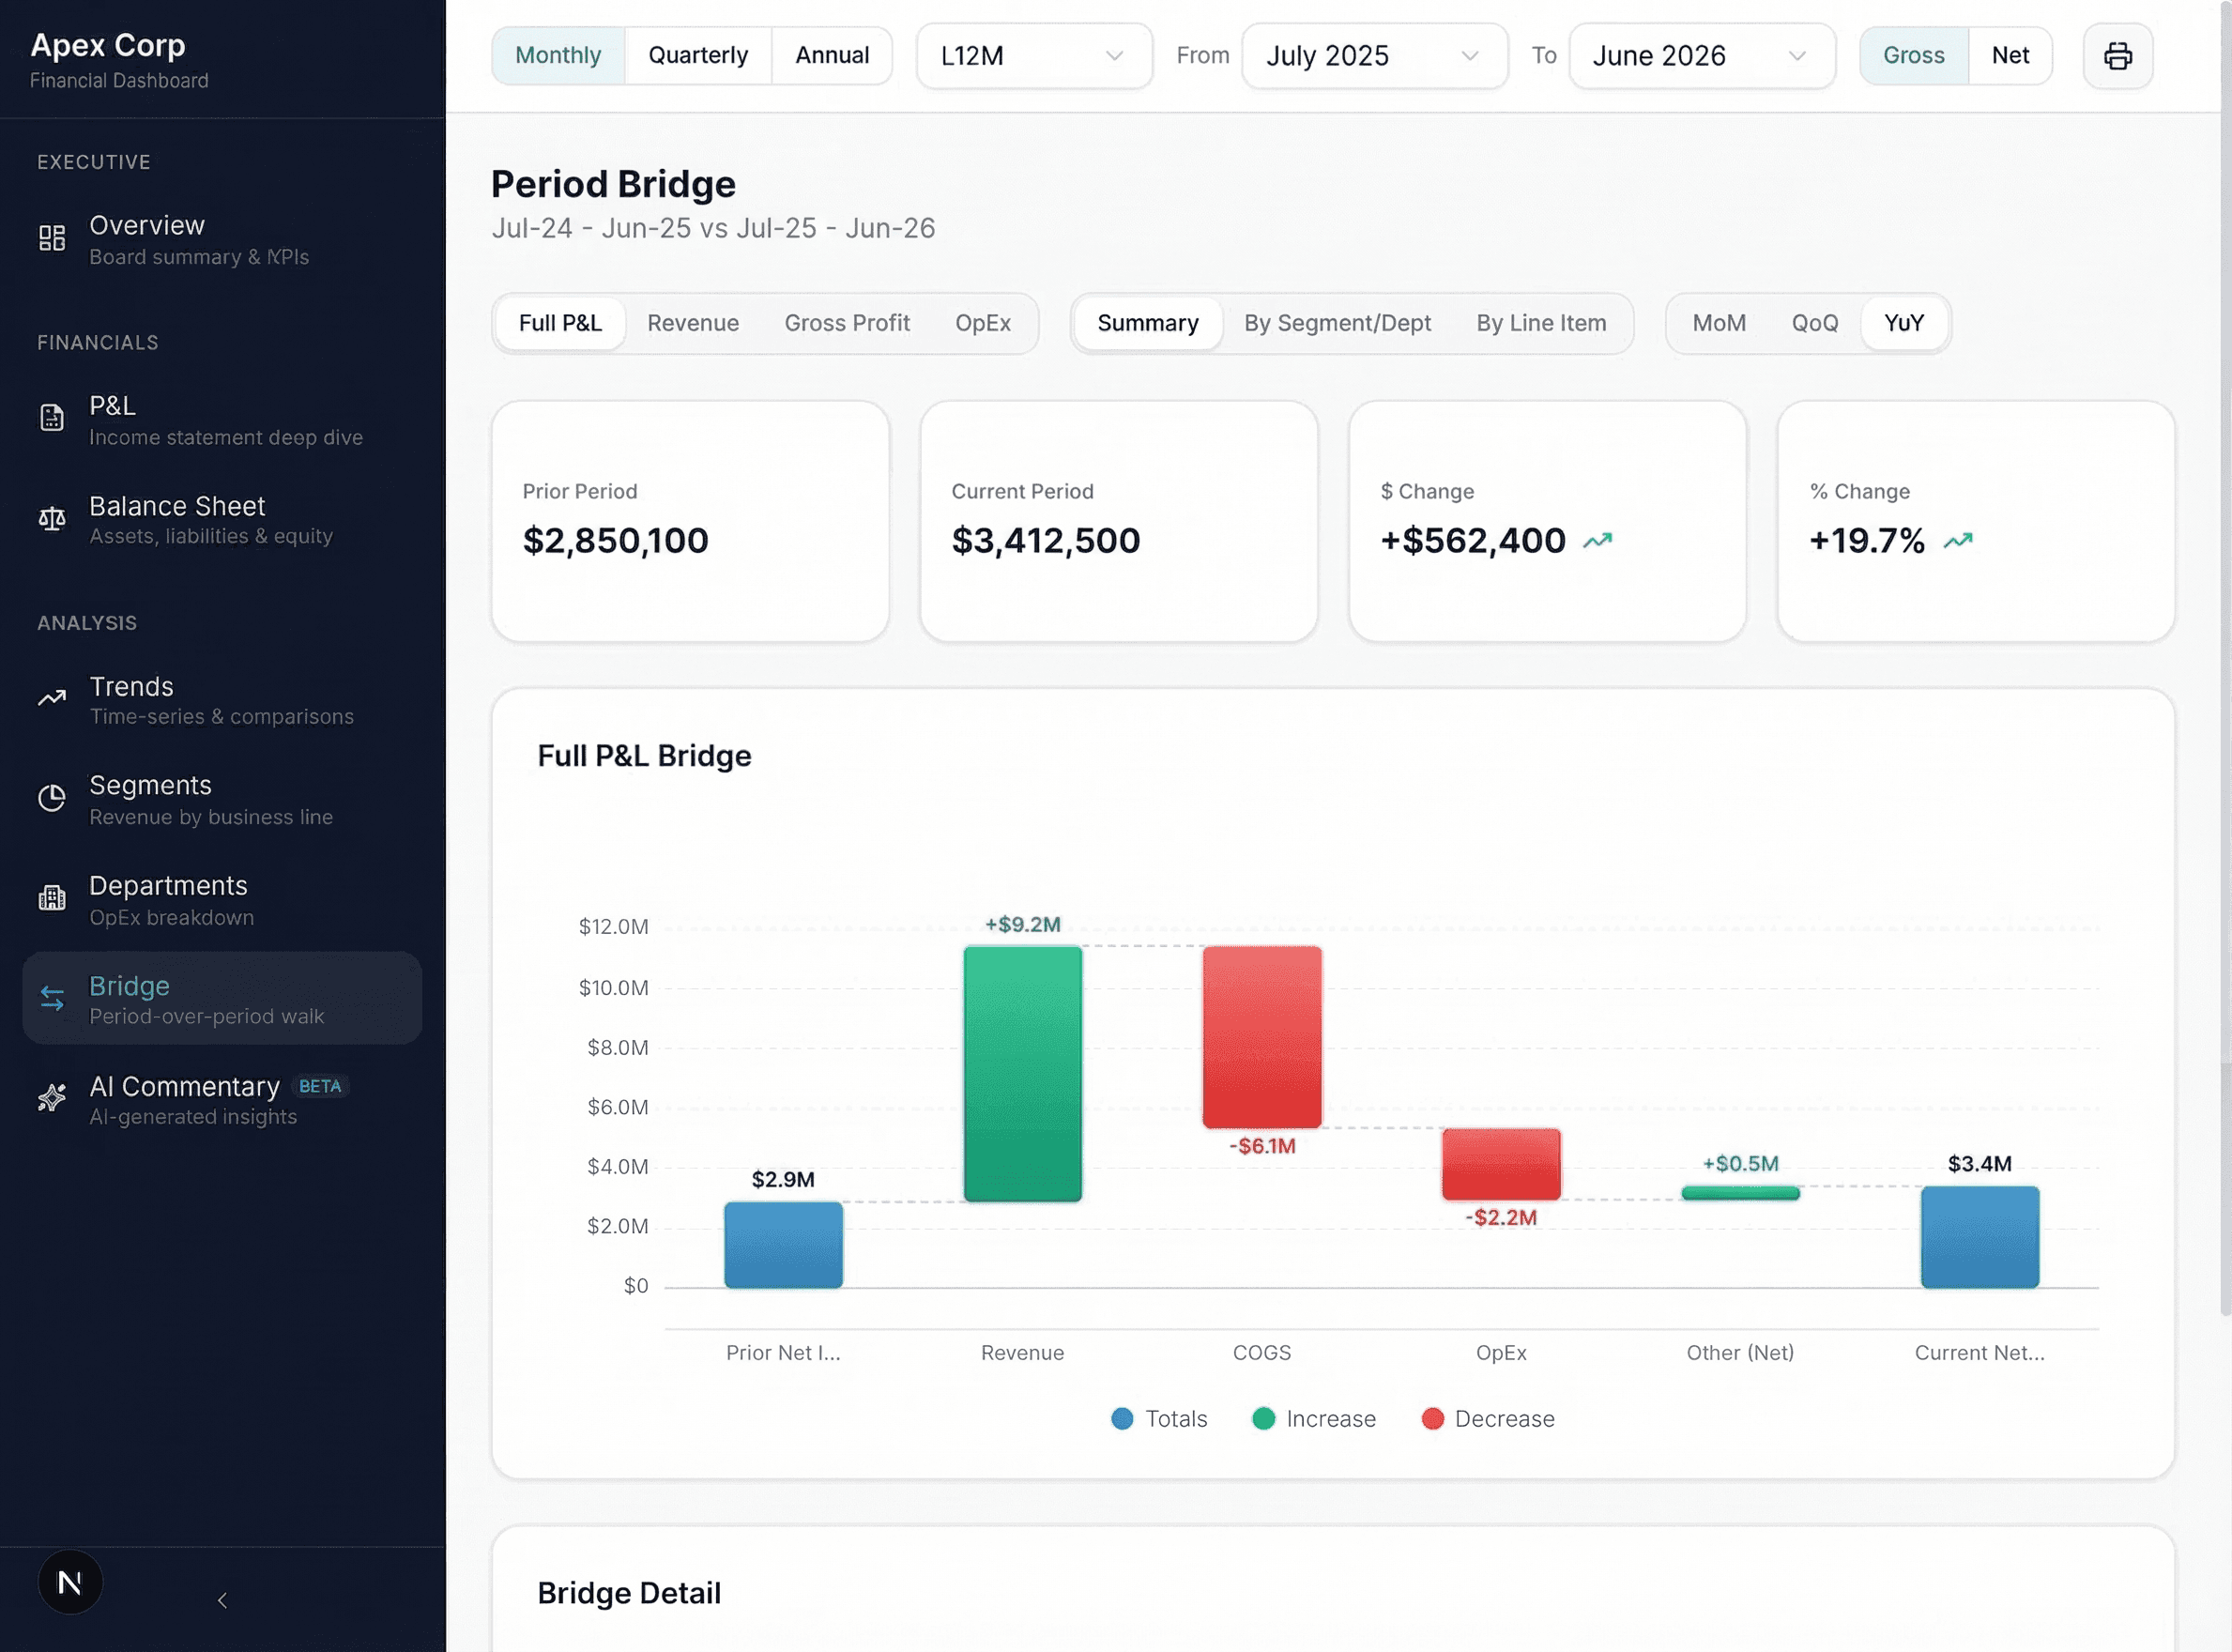
The product breakdown view shows capital allocation across different case types, with trend lines showing how the mix has shifted over time. This replaced a quarterly analysis that the CFO used to request manually.
All data refreshes daily via an automated pipeline that pulls from the core operational database, transforms and enriches the records, and loads them into the dashboard's PostgreSQL backend. The pipeline includes data quality checks that flag anomalies before they reach the dashboard.
Results
The platform eliminated the monthly reporting cycle entirely. The two-day report generation process was replaced by a dashboard that's always current. The operations team redirected roughly 20 hours per month from report building to actual portfolio management.
Within the first month, the concentration monitoring caught a counterparty whose exposure had crept from 5% to 11% of the portfolio. Under the old system, this wouldn't have been flagged until the next quarterly review.
The aging alerts now generate a weekly action list for the operations team, prioritized by capital at risk. Cases that would have aged past intervention windows are now caught consistently. The CFO estimates this has improved recovery outcomes on aging cases by identifying problems an average of 45 days earlier than the previous process.
Product Screenshots
Need something like this built?
I build custom dashboards and analytics tools for finance teams. Let's talk about what you're working with.
Book a 30-Minute Conversationor email us at hello@strategiq.so